Why I’m Geeking Out About the New Pinterest Analytics

I’ve been killing our Lightspan productivity this morning. Why?

If you’re like me, you’re geeking out on the new Pinterest Analytics that the social network rolled out this morning. But you’re probably not like me, driving your co-workers crazy with each new feature you find in the analytics. Rather than drive my office nuts all day, I figured I’d take my thoughts to our blog.

Here’s what you need to know.

Getting Started

  1. Get early access to Pinterest’s new look.
  2. Make sure you have a verified website. If you have a website listed on your profile with a checkmark next to it, you’re verified. If not, follow these steps to verify.
  3. Once your website is verified, go to the top right menu and click on “Analytics.”
  4. Start exploring! Change your date range to see how things have changed over time or download your analytics to sort through the data on your own time.
As a community manager, I’m excited to start inserting these Pinterest Analytics into my client’s monthly reports. Previously I had to manually add pins, repins and comments, or  use subpar third party websites to collect data. This makes it easier than ever to see what content is driving the most interest and website traffic.

Site Metrics

Pinterest’s new site metrics will change how you measure your efforts.

The Site Metrics tab under Analytics allows us to keep track of:

  • Pins (the daily average number of pins from your website)
  • Pinners (the daily average number of people who pinned from your website)
  • Repins (the daily average number of times pins from your website were repinned on Pinterest)
  • Repinners (the daily average number of people who repinned your pins)
  • Impressions (the daily average number of times your pins appeared on Pinterest in the main feed, in search results, or on on boards)
  • Reach (the daily average number of people who saw your pins on Pinterest)
  • Clicks (the daily average number of clicks to your website that came from Pinterest)
  • Visitors (the daily average number of people who visited your website from Pinterest).

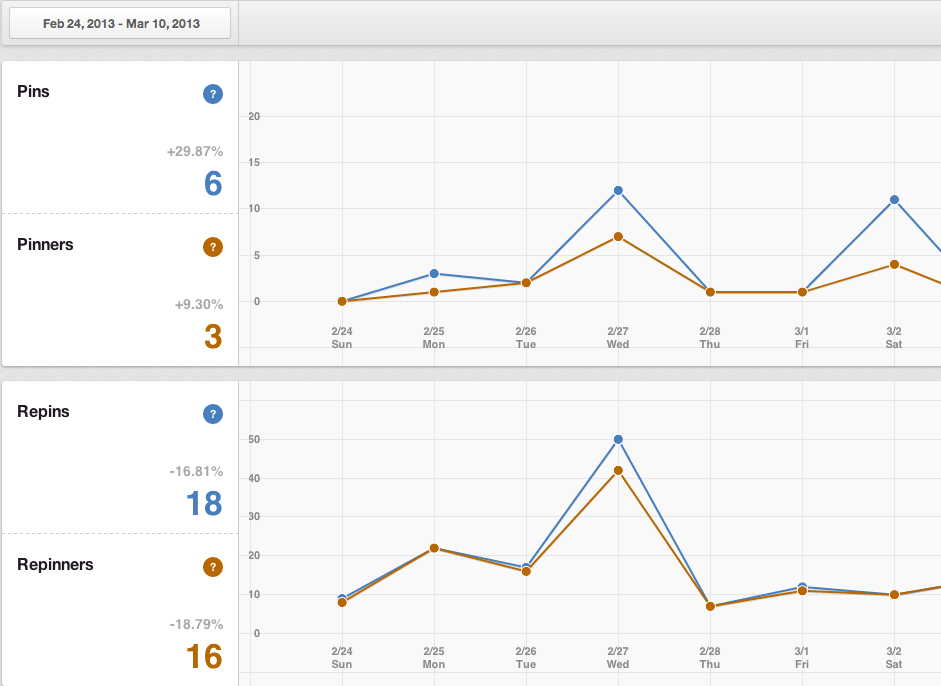
These simple charts show you more than just the pins YOU post on Pinterest and they don’t include “filler” content pins from other sources. This is raw data for every pin that is pinned directly from your website, including your pins and those of your site’s visitors.

Above you’ll see a couple screen shots from a client with a heavy Pinterest presence. The percentages represent the percent increase or decrease from the previous time period. This is a big help in community management reporting. The numbers listed are an average number for the time period indicated. The Analytics tool allows you to change the time period to whatever suits your needs.

Most Recent

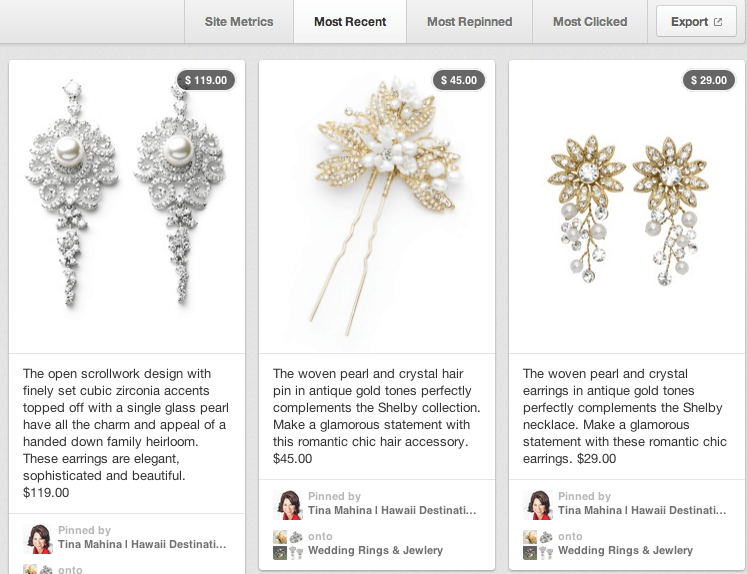
Pinterest’s “Most Recent” tab is a great way to keep track of who is pinning from your website and what items they are pinning. This real-time information is useful to see what people are interested in right now.

Most Repinned / Most Clicked

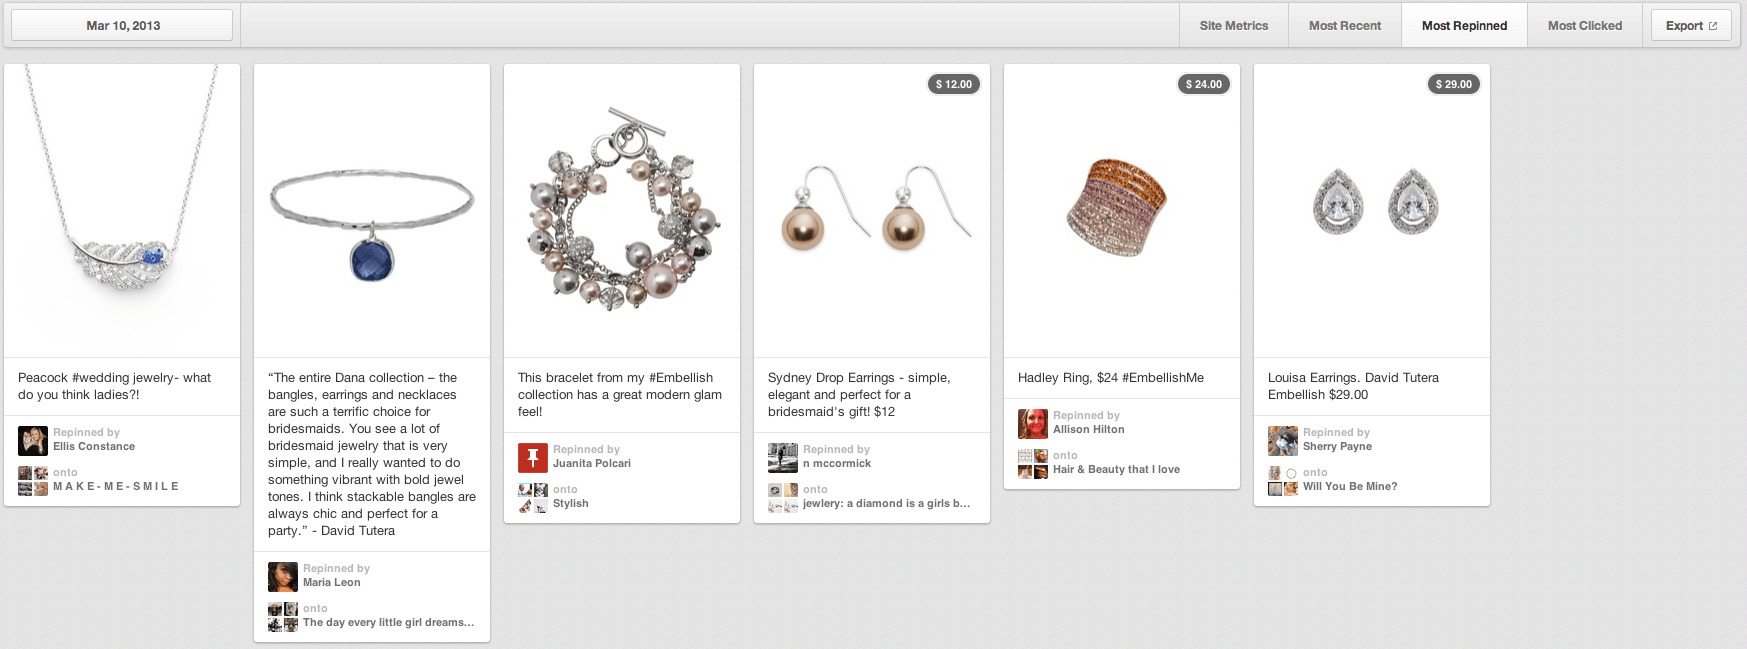
These two tabs show data by specific day (with a one-day lag). HINT: When you find a spike in the site metrics section, dig deeper and see what pins had the most repins and clicks for that day.

Best Practices:

  1. Connect with the people that made the “most repinned” and “most clicked” pins. Pinterest Analytics is sorting through all of the users that pin your content and is handing you your top brand advocates on a silver platter. Comment on these pins and thank them!
  2. Use these tabs to see what products are getting the most interactions (repins and clicks) and use this information to promote these specific products across all of your social platforms.
  3. Review this daily to see if you notice any trends. Are certain products doing better on certain days? Finally we have an easy way to do this!

That’s All Folks…

As my headphone-clad co-workers can attest, I’m extremely excited about this newest Pinterest update and look forward to learning more about what I can do with these new tools. Once you look around a little, comment below and share your thoughts. Do you like this new feature? How do you see this benefiting you? What are you most excited about?

Mana

Mana [Mah’-nah] Ionescu [Yo-nes’-koo] believes in digital marketing done with purpose. Her mission is to bust digital marketing myths and put marketing back in social media marketing.

Disqus Comments Loading...
Share
Published by
Mana

Recent Posts

Myth Busting Social Media Demographics Reports: Do Gen Z-ers Spend the Most Time On Social Media?

In social media marketing we seek to develop strategies that will reach the right audiences…

2 years ago

While Pushing Reels, Meta Shares Insights Into Their Video Distribution Algorithm

Meta recently published a guide to explain video distribution on Facebook, in which they share…

2 years ago

Top Brands Report Shows How to Capture Mindshare; LinkedIn’s State of Sales Report; Meta’s Flurry of Changes

Hi friends, With the seemingly never-ending series of awful events and news, it’s been hard…

2 years ago

Did GOP Posts Get A Boost From the Facebook Algorithm?; Google May Core Update And Ai-Generated Content; Lessons From Top LinkedIn Posts

Study Associates Changes In Facebook’s Algorithm With Amplified Local Republican Parties’ Posts [skip to the…

2 years ago

How to Pack a Punch With Your Visuals; YNTK FaZe Clan; Can You Sue If You’re Banned?; Musk’s Lofty Twitter Growth Goals

This week I’m diving into some unique topics that we need to talk about more: …

2 years ago

TikTok, Instagram, AND Pinterest Signal Big Changes; No One Cares About this Facebook Move; From Personalization to Individualization

What the heck happened this week? Besides the Supreme Court writing, “that the right to…

2 years ago